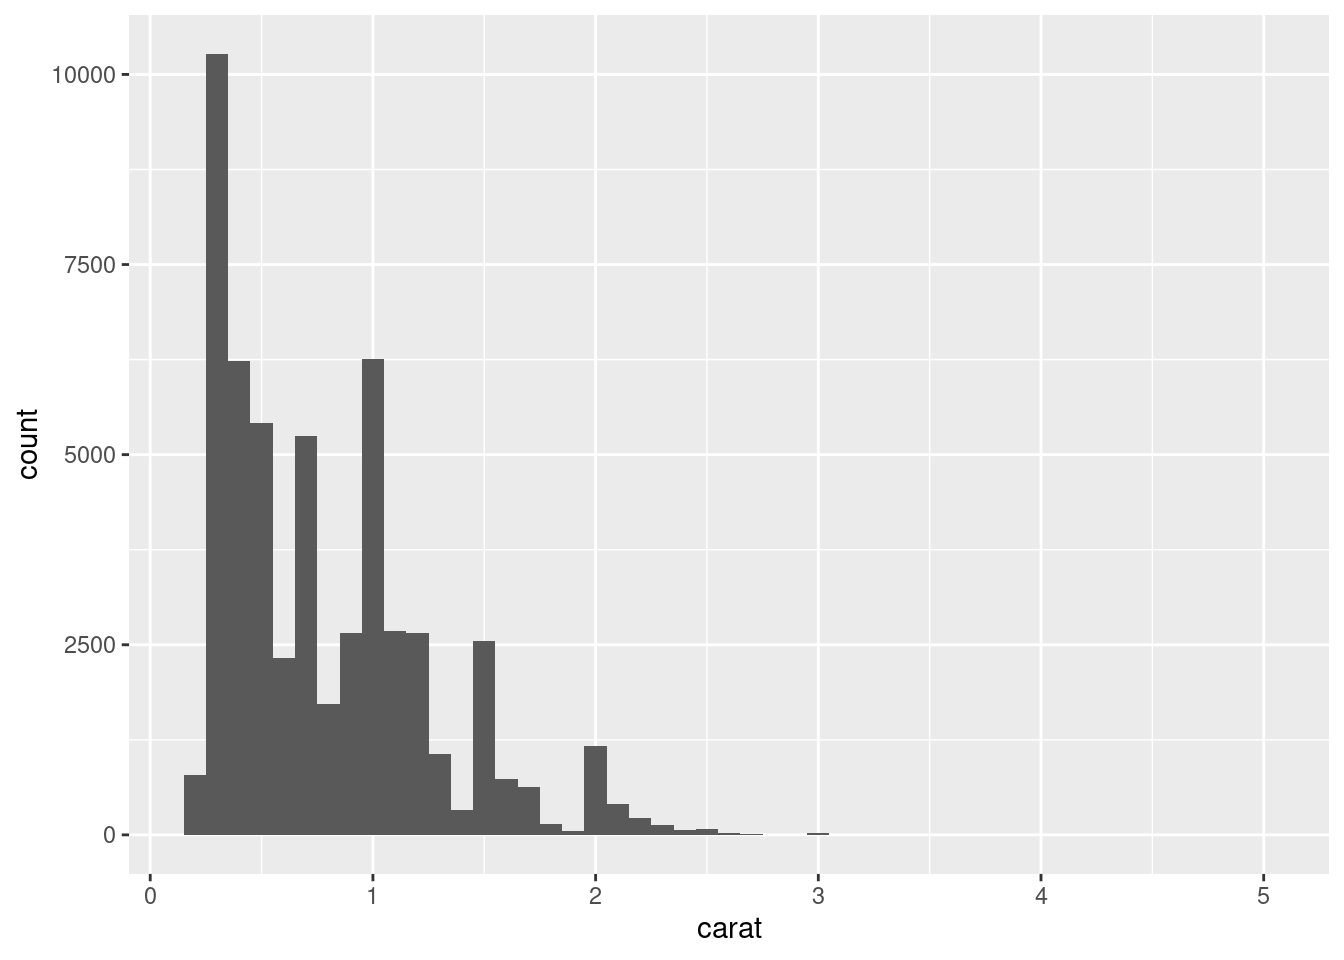
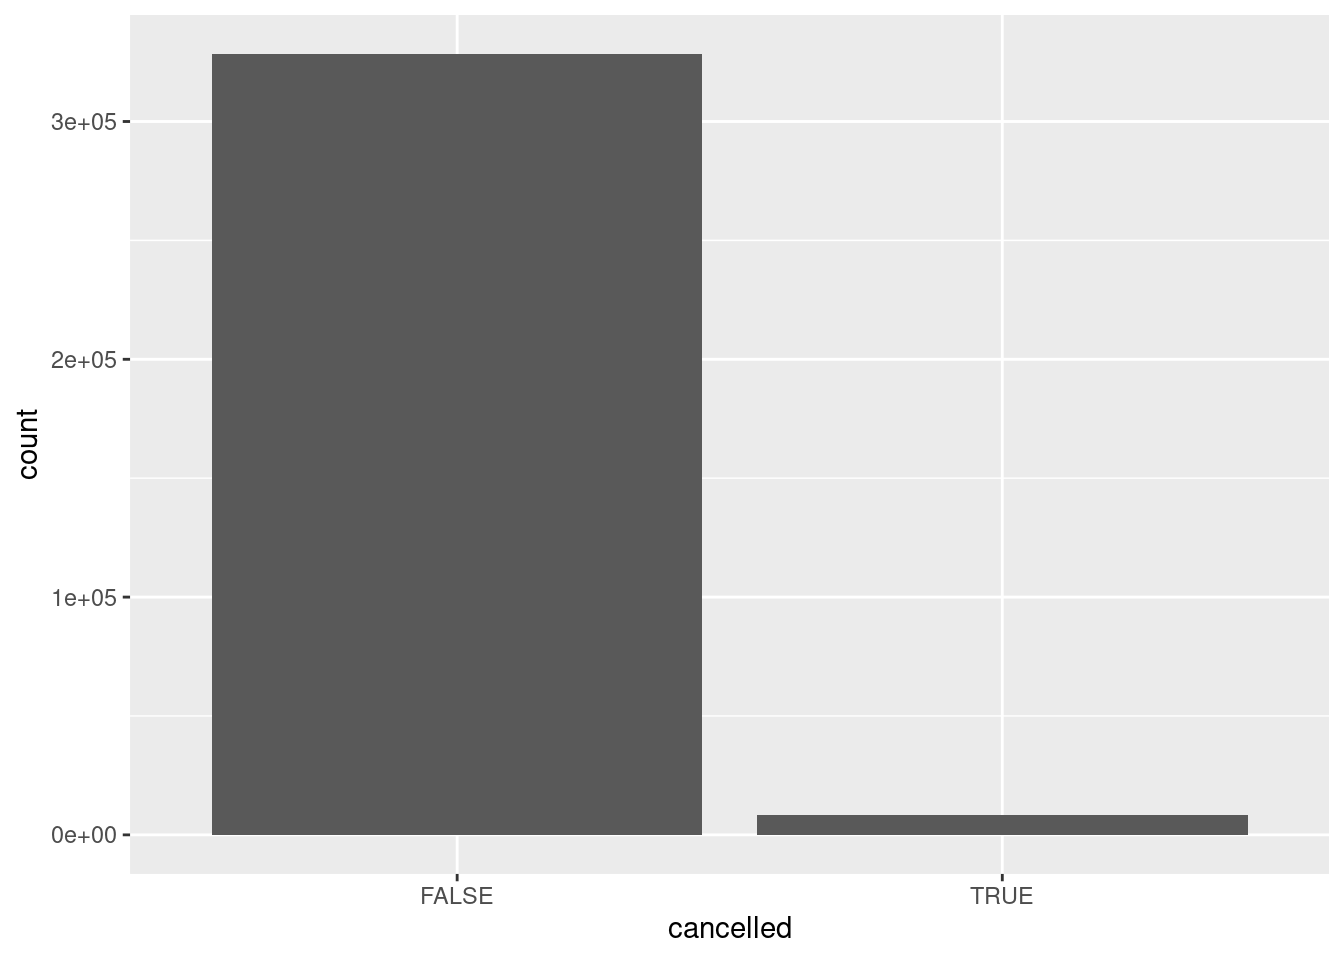
11  Exploratory data analysis

11.1 Notes

library(tidyverse)
── Attaching packages ─────────────────────────────────────── tidyverse 1.3.2 ──
✔ ggplot2 3.4.0     ✔ purrr   1.0.1
✔ tibble  3.1.8     ✔ dplyr   1.1.0
✔ tidyr   1.3.0     ✔ stringr 1.5.0
✔ readr   2.1.3     ✔ forcats 1.0.0
── Conflicts ────────────────────────────────────────── tidyverse_conflicts() ──
✖ dplyr::filter() masks stats::filter()
✖ dplyr::lag()    masks stats::lag()
library(ggbeeswarm)

Scatterplots become less useful as the size of your dataset grows, because points begin to overplot, and pile up into areas of uniform black (as above). You’ve already seen one way to fix the problem: using the alpha aesthetic to add transparency

But using transparency can be challenging for very large datasets. Another solution is to use bin. Previously you used geom_histogram() and geom_freqpoly() to bin in one dimension. Now you’ll learn how to use geom_bin2d() and geom_hex() to bin in two dimensions.

geom_bin2d() and geom_hex() divide the coordinate plane into 2d bins and then use a fill color to display how many points fall into each bin. geom_bin2d() creates rectangular bins. geom_hex() creates hexagonal bins. You will need to install the hexbin package to use geom_hex().

Heatmaply package and seriation package:

If the categorical variables are unordered, you might want to use the seriation package to simultaneously reorder the rows and columns in order to more clearly reveal interesting patterns. For larger plots, you might want to try the heatmaply package, which creates interactive plots.

Another approach for exploring the relationship between these variables is computing the counts with dplyr:

diamonds |> 
  count(color, cut)
# A tibble: 35 × 3
   color cut           n
   <ord> <ord>     <int>
 1 D     Fair        163
 2 D     Good        662
 3 D     Very Good  1513
 4 D     Premium    1603
 5 D     Ideal      2834
 6 E     Fair        224
 7 E     Good        933
 8 E     Very Good  2400
 9 E     Premium    2337
10 E     Ideal      3903
# … with 25 more rows
#> # A tibble: 35 × 3
#>   color cut           n
#>   <ord> <ord>     <int>
#> 1 D     Fair        163
#> 2 D     Good        662
#> 3 D     Very Good  1513
#> 4 D     Premium    1603
#> 5 D     Ideal      2834
#> 6 E     Fair        224
#> # … with 29 more rows

Then visualize with geom_tile() and the fill aesthetic:

diamonds |> 
  count(color, cut) |>  
  ggplot(aes(x = color, y = cut)) +
  geom_tile(aes(fill = n))

To visualize the covariation between categorical variables, you’ll need to count the number of observations for each combination of levels of these categorical variables. One way to do that is to rely on the built-in geom_count()

ggplot(diamonds, aes(x = cut, y = color)) +
  geom_count()

Instead, we recommend replacing the unusual values with missing values. The easiest way to do this is to use mutate() to replace the variable with a modified copy. You can use the if_else() function to replace unusual values with NA:

diamonds |> 
  mutate(y = if_else(y < 3 | y > 20, NA, y))
# A tibble: 53,940 × 10
   carat cut       color clarity depth table price     x     y     z
   <dbl> <ord>     <ord> <ord>   <dbl> <dbl> <int> <dbl> <dbl> <dbl>
 1  0.23 Ideal     E     SI2      61.5    55   326  3.95  3.98  2.43
 2  0.21 Premium   E     SI1      59.8    61   326  3.89  3.84  2.31
 3  0.23 Good      E     VS1      56.9    65   327  4.05  4.07  2.31
 4  0.29 Premium   I     VS2      62.4    58   334  4.2   4.23  2.63
 5  0.31 Good      J     SI2      63.3    58   335  4.34  4.35  2.75
 6  0.24 Very Good J     VVS2     62.8    57   336  3.94  3.96  2.48
 7  0.24 Very Good I     VVS1     62.3    57   336  3.95  3.98  2.47
 8  0.26 Very Good H     SI1      61.9    55   337  4.07  4.11  2.53
 9  0.22 Fair      E     VS2      65.1    61   337  3.87  3.78  2.49
10  0.23 Very Good H     VS1      59.4    61   338  4     4.05  2.39
# … with 53,930 more rows

coord_cartesian() zoom into y

ggplot(diamonds, aes(x = y)) + 
  geom_histogram(binwidth = 0.5) +
  coord_cartesian(ylim = c(0, 50))

11.2 Solutions

11.3 Exercise 12.3.3

1.Explore the distribution of each of the x, y, and z variables in diamonds. What do you learn? Think about a diamond and how you might decide which dimension is the length, width, and depth.

look up help ?diamonds

library(tidyverse)


ggplot(diamonds, aes(x = x , y = y)) + geom_point()

x is the length, y is the width, z is the depth

2.Explore the distribution of price. Do you discover anything unusual or surprising? (Hint: Carefully think about the binwidth and make sure you try a wide range of values.)

ggplot(diamonds, aes(x = price)) + geom_histogram(binwidth = 2000)

3.How many diamonds are 0.99 carat? How many are 1 carat? What do you think is the cause of the difference?

ggplot(diamonds, aes(x = carat)) + geom_histogram(binwidth = .1)

4.Compare and contrast coord_cartesian() vs. xlim() or ylim() when zooming in on a histogram. What happens if you leave binwidth unset? What happens if you try and zoom so only half a bar shows?

ggplot(diamonds, aes(x = carat)) + geom_histogram(binwidth = .1) +
  coord_cartesian(xlim = c(0,50))

ggplot(diamonds, aes(x = carat)) + geom_histogram(binwidth = .1) + 
  coord_cartesian(ylim = c(0,50))

so it looks like when you use the xlim it zooms out but when you use the ylim it zooms in

11.4 Exercise 12.4.1

1.What happens to missing values in a histogram? What happens to missing values in a bar chart? Why is there a difference in how missing values are handled in histograms and bar charts?

the missing values are removed with a warning

2.What does na.rm = TRUE do in mean() and sum()?

for mean it determines whether na’s should be removed or not and for sum should na values be removed and certain other values

11.5 Exercise 12.5.1.1

1.Use what you’ve learned to improve the visualization of the departure times of cancelled vs. non-cancelled flights.

canceled_flights <- nycflights13::flights |> 
  mutate(
    cancelled = is.na(dep_time),
    sched_hour = sched_dep_time %/% 100,
    sched_min = sched_dep_time %% 100,
    sched_dep_time = sched_hour + (sched_min / 60)
  ) 

ggplot(canceled_flights,aes(x = cancelled)) +
  geom_bar()

2.What variable in the diamonds dataset is most important for predicting the price of a diamond? How is that variable correlated with cut? Why does the combination of those two relationships lead to lower quality diamonds being more expensive?

i would say maybe clarity or just straight up price, i think because the lower quality diamonds correspond to people buying them who don’t really know about diamonds or don’t care about the quality,theres alot more lower quality diamonds than higher quality

?diamonds

3.Instead of exchanging the x and y variables, add coord_flip() as a new layer to the vertical boxplot to create a horizontal one. How does this compare to using exchanging the variables?

it switching the x and y its alot faster

ggplot(mpg, aes(x = hwy, y = fct_reorder(class, hwy, median))) +
  geom_boxplot() + coord_flip()

4.One problem with boxplots is that they were developed in an era of much smaller datasets and tend to display a prohibitively large number of “outlying values”. One approach to remedy this problem is the letter value plot. Install the lvplot package, and try using geom_lv() to display the distribution of price vs. cut. What do you learn? How do you interpret the plots?

my version of r can’t get this

5.Compare and contrast geom_violin() with a faceted geom_histogram(), or a colored geom_freqpoly(). What are the pros and cons of each method?

geom_violin shows a basic understanding of the amount of diamonds while geom_histogram shows the further outliers better and where they are and geom_freqpoly shows the count better

ggplot(diamonds,aes(x = price, y = clarity)) +
  geom_violin()

ggplot(diamonds,aes(x = price)) +
  geom_histogram() +
  facet_wrap(~clarity, ncol = 1, scales = "free_y")
`stat_bin()` using `bins = 30`. Pick better value with `binwidth`.

#> `stat_bin()` using `bins = 30`. Pick better value with `binwidth`
ggplot(diamonds,aes(x = price, color = clarity)) +
  geom_freqpoly()
`stat_bin()` using `bins = 30`. Pick better value with `binwidth`.

#> `stat_bin()` using `bins = 30`. Pick better value with `binwidth`.

6.If you have a small dataset, it’s sometimes useful to use geom_jitter() to see the relationship between a continuous and categorical variable. The ggbeeswarm package provides a number of methods similar to geom_jitter(). List them and briefly describe what each one does

so geom_beeswarm makes it so you have more control over overplotting datasets, while geom_jitter to me seems like just a default that you can use on the go but if you do want more customization ggbeeswarm is better for handling overplotting

11.6 Exercise 12.5.2.1

1.How could you rescale the count dataset above to more clearly show the distribution of cut within color, or color within cut?

i can use this code from earlier that shows exactly that

ggplot(diamonds, aes(x = cut, y = color)) +
  geom_count()

2.How does the segmented bar chart change if color is mapped to the x aesthetic and cut is mapped to the fill aesthetic? Calculate the counts that fall into each of the segments.

count(diamonds,color,cut)
# A tibble: 35 × 3
   color cut           n
   <ord> <ord>     <int>
 1 D     Fair        163
 2 D     Good        662
 3 D     Very Good  1513
 4 D     Premium    1603
 5 D     Ideal      2834
 6 E     Fair        224
 7 E     Good        933
 8 E     Very Good  2400
 9 E     Premium    2337
10 E     Ideal      3903
# … with 25 more rows
 ggplot(diamonds,aes( x = color, fill = cut)) +
  geom_bar(position = "fill")

3.Use geom_tile() together with dplyr to explore how average flight delays vary by destination and month of year. What makes the plot difficult to read? How could you improve it?

glimpse(nycflights13::flights)
Rows: 336,776
Columns: 19
$ year           <int> 2013, 2013, 2013, 2013, 2013, 2013, 2013, 2013, 2013, 2…
$ month          <int> 1, 1, 1, 1, 1, 1, 1, 1, 1, 1, 1, 1, 1, 1, 1, 1, 1, 1, 1…
$ day            <int> 1, 1, 1, 1, 1, 1, 1, 1, 1, 1, 1, 1, 1, 1, 1, 1, 1, 1, 1…
$ dep_time       <int> 517, 533, 542, 544, 554, 554, 555, 557, 557, 558, 558, …
$ sched_dep_time <int> 515, 529, 540, 545, 600, 558, 600, 600, 600, 600, 600, …
$ dep_delay      <dbl> 2, 4, 2, -1, -6, -4, -5, -3, -3, -2, -2, -2, -2, -2, -1…
$ arr_time       <int> 830, 850, 923, 1004, 812, 740, 913, 709, 838, 753, 849,…
$ sched_arr_time <int> 819, 830, 850, 1022, 837, 728, 854, 723, 846, 745, 851,…
$ arr_delay      <dbl> 11, 20, 33, -18, -25, 12, 19, -14, -8, 8, -2, -3, 7, -1…
$ carrier        <chr> "UA", "UA", "AA", "B6", "DL", "UA", "B6", "EV", "B6", "…
$ flight         <int> 1545, 1714, 1141, 725, 461, 1696, 507, 5708, 79, 301, 4…
$ tailnum        <chr> "N14228", "N24211", "N619AA", "N804JB", "N668DN", "N394…
$ origin         <chr> "EWR", "LGA", "JFK", "JFK", "LGA", "EWR", "EWR", "LGA",…
$ dest           <chr> "IAH", "IAH", "MIA", "BQN", "ATL", "ORD", "FLL", "IAD",…
$ air_time       <dbl> 227, 227, 160, 183, 116, 150, 158, 53, 140, 138, 149, 1…
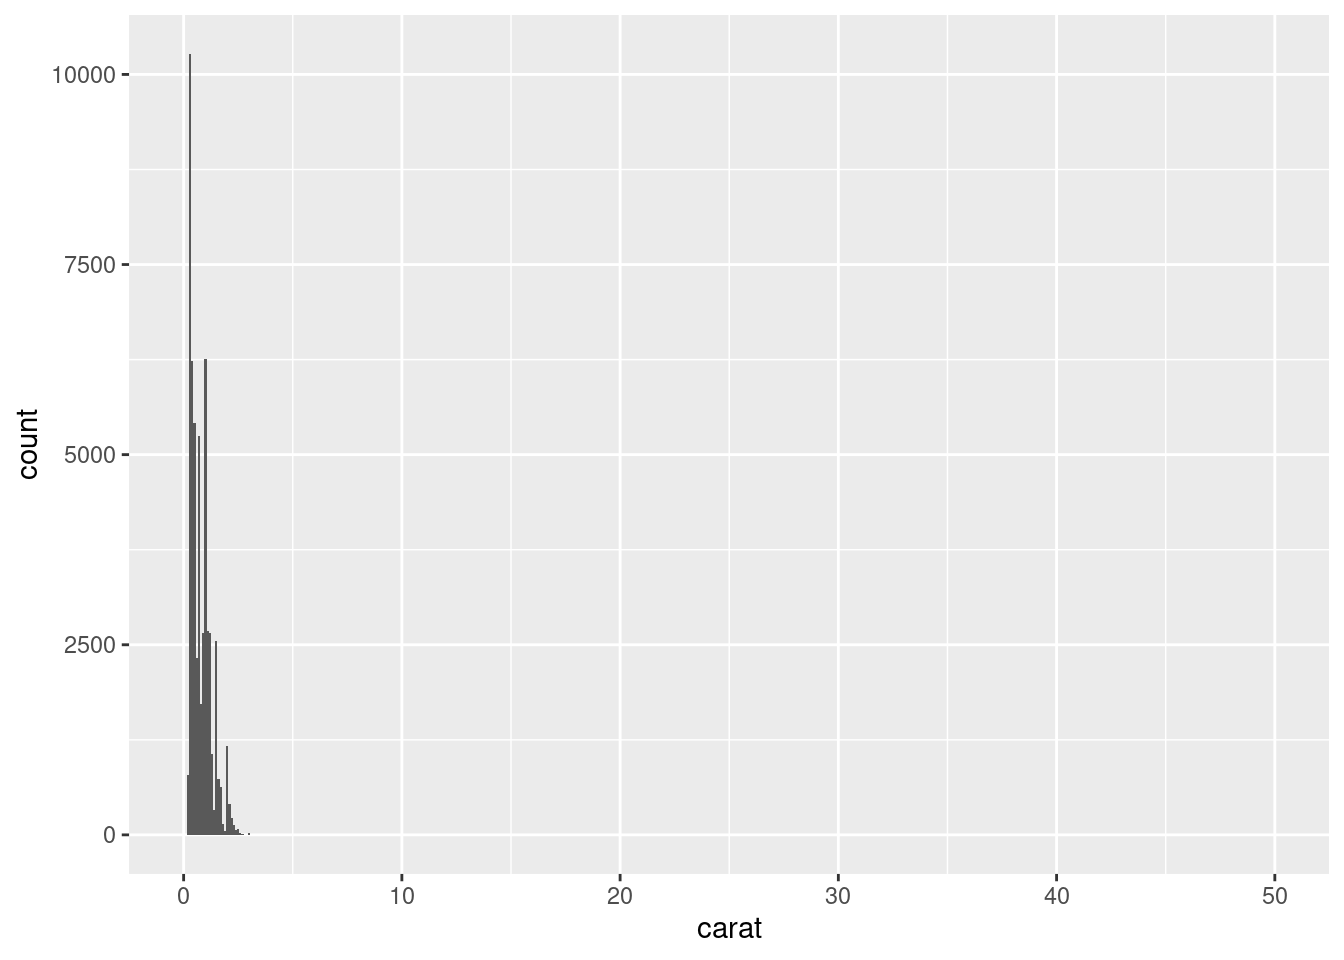
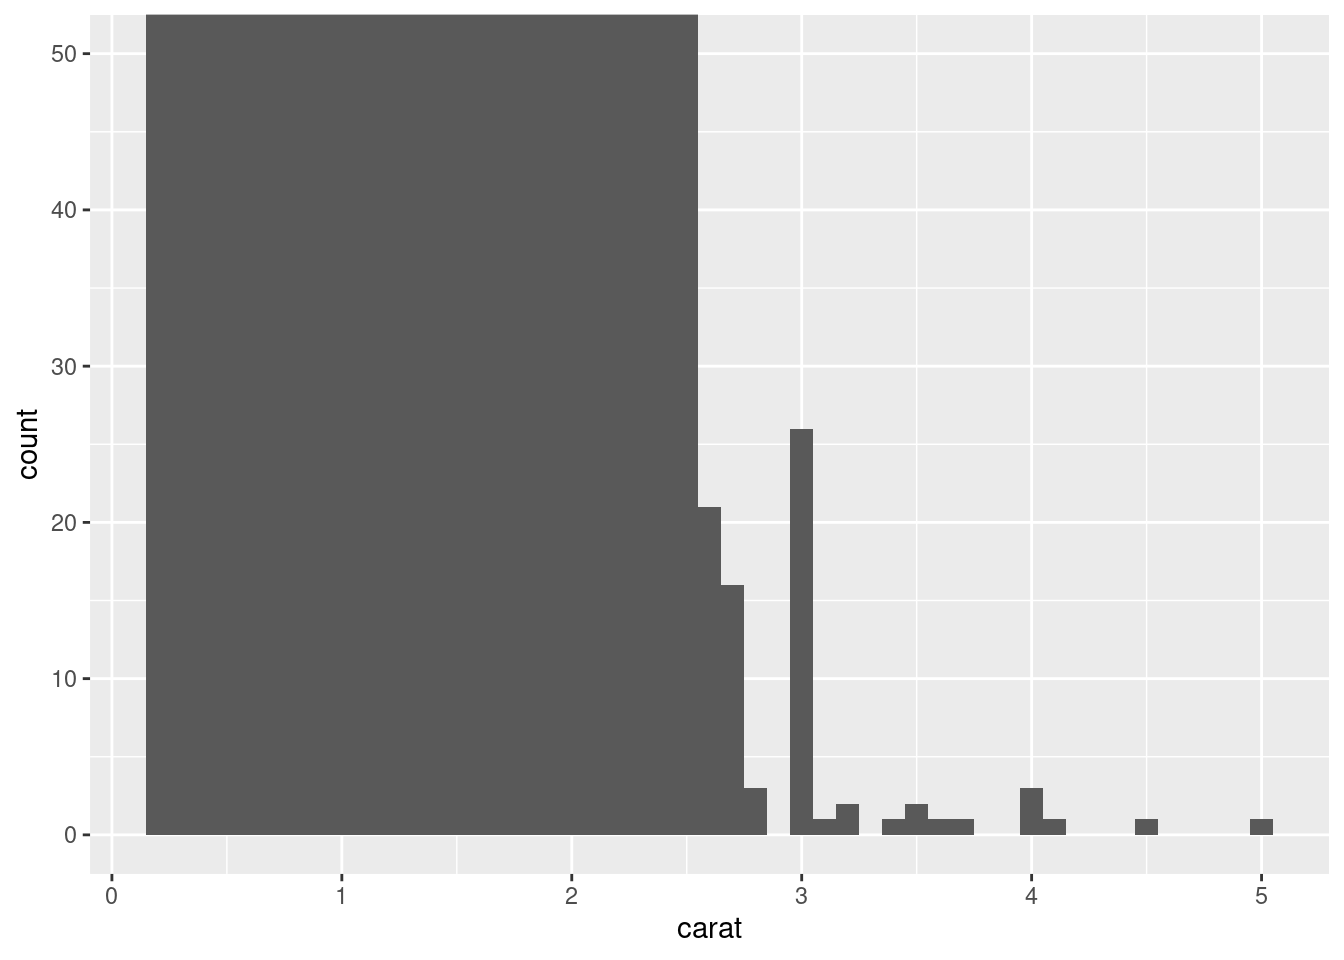
$ distance       <dbl> 1400, 1416, 1089, 1576, 762, 719, 1065, 229, 944, 733, …
$ hour           <dbl> 5, 5, 5, 5, 6, 5, 6, 6, 6, 6, 6, 6, 6, 6, 6, 5, 6, 6, 6…
$ minute         <dbl> 15, 29, 40, 45, 0, 58, 0, 0, 0, 0, 0, 0, 0, 0, 0, 59, 0…
$ time_hour      <dttm> 2013-01-01 05:00:00, 2013-01-01 05:00:00, 2013-01-01 0…
nycflights13::flights %>% summarise(dest,month,year) %>% 
  group_by(dest,month)
Warning: Returning more (or less) than 1 row per `summarise()` group was deprecated in
dplyr 1.1.0.
ℹ Please use `reframe()` instead.
ℹ When switching from `summarise()` to `reframe()`, remember that `reframe()`
  always returns an ungrouped data frame and adjust accordingly.
# A tibble: 336,776 × 3
# Groups:   dest, month [1,113]
   dest  month  year
   <chr> <int> <int>
 1 IAH       1  2013
 2 IAH       1  2013
 3 MIA       1  2013
 4 BQN       1  2013
 5 ATL       1  2013
 6 ORD       1  2013
 7 FLL       1  2013
 8 IAD       1  2013
 9 MCO       1  2013
10 ORD       1  2013
# … with 336,766 more rows

11.7 Exercise 12.5.3.1

smaller <- diamonds |> 
  filter(carat < 3)

1.Instead of summarizing the conditional distribution with a boxplot, you could use a frequency polygon. What do you need to consider when using cut_width() vs. cut_number()? How does that impact a visualization of the 2d distribution of carat and price?

if you want to use cut_width know you r datas values,if you use cut_number know your sample size

# visualize price binning by carat, cut_width()
ggplot(smaller, aes(x = price, y = ..density..,)) +
  geom_freqpoly(aes(color = cut_width(carat, 0.5)))
Warning: The dot-dot notation (`..density..`) was deprecated in ggplot2 3.4.0.
ℹ Please use `after_stat(density)` instead.
`stat_bin()` using `bins = 30`. Pick better value with `binwidth`.

# visualize price binning by carat, cut_number(), 10 bins
ggplot(smaller, aes(x = price, y = ..density..,)) +
  geom_freqpoly(aes(color = cut_number(carat, 10)))
`stat_bin()` using `bins = 30`. Pick better value with `binwidth`.

2.Visualize the distribution of carat, partitioned by price.

ggplot(diamonds, aes(x = price, y = carat)) + 
  geom_boxplot()
Warning: Continuous x aesthetic
ℹ did you forget `aes(group = ...)`?

3.How does the price distribution of very large diamonds compare to small diamonds? Is it as you expect, or does it surprise you?

its not what i expect even the large diamonds are the same price as smaller diamonds

ggplot(diamonds,aes(x = carat,y = price)) +
  geom_point()

4.Combine two of the techniques you’ve learned to visualize the combined distribution of cut, carat, and price.

ggplot(diamonds,aes(x = price,color = cut,fill = cut)) +
  geom_freqpoly()
`stat_bin()` using `bins = 30`. Pick better value with `binwidth`.

ggplot(diamonds,aes(x = carat,color = cut,fill = cut)) +
  geom_freqpoly()
`stat_bin()` using `bins = 30`. Pick better value with `binwidth`.

5.Two dimensional plots reveal outliers that are not visible in one dimensional plots. For example, some points in the following plot have an unusual combination of x and y values, which makes the points outliers even though their x and y values appear normal when examined separately. Why is a scatterplot a better display than a binned plot for this case?

because this scatterplot shows outliers and binned plots don’t

diamonds |> 
  filter(x >= 4) |> 
  ggplot(aes(x = x, y = y)) +
  geom_point() +
  coord_cartesian(xlim = c(4, 11), ylim = c(4, 11))

diamonds |> 
  filter(x >= 4) |> 
ggplot(aes(x = x)) +
  geom_histogram()
`stat_bin()` using `bins = 30`. Pick better value with `binwidth`.

6.Instead of creating boxes of equal width with cut_width(), we could create boxes that contain roughly equal number of points with cut_number(). What are the advantages and disadvantages of this approach?

if you want to control the width you use cut_width, if you want to choose the number of bins use cut_number

ggplot(smaller, aes(x = carat, y = price)) + 
  geom_boxplot(aes(group = cut_number(carat, 20)))

smaller %>% 
  mutate(carat_group = cut_number(carat,20)) %>% 
  count(carat_group)
# A tibble: 20 × 2
   carat_group     n
   <fct>       <int>
 1 [0.2,0.3]    4203
 2 (0.3,0.31]   2249
 3 (0.31,0.32]  1840
 4 (0.32,0.35]  2766
 5 (0.35,0.4]   3333
 6 (0.4,0.42]   2088
 7 (0.42,0.5]   2453
 8 (0.5,0.53]   2653
 9 (0.53,0.6]   2863
10 (0.6,0.7]    2714
11 (0.7,0.73]   2550
12 (0.73,0.9]   3890
13 (0.9,1]      2836
14 (1,1.01]     2242
15 (1.01,1.04]  1881
16 (1.04,1.13]  2692
17 (1.13,1.23]  2584
18 (1.23,1.51]  3468
19 (1.51,1.7]   1950
20 (1.7,2.8]    2645
ggplot(smaller, aes(x = carat, y = price)) + 
  geom_boxplot(aes(group = cut_width(carat, .1)))

smaller %>% 
  mutate(carat_group = cut_width(carat,.1)) %>% 
  count(carat_group)
# A tibble: 27 × 2
   carat_group     n
   <fct>       <int>
 1 [0.15,0.25]   785
 2 (0.25,0.35] 10273
 3 (0.35,0.45]  6231
 4 (0.45,0.55]  5417
 5 (0.55,0.65]  2328
 6 (0.65,0.75]  5249
 7 (0.75,0.85]  1725
 8 (0.85,0.95]  2656
 9 (0.95,1.05]  6258
10 (1.05,1.15]  2687
# … with 17 more rows