##Solutions
3.5 Exercises
1.why does this code not work?
because in my_variable theres a 1 instead of an i in variable
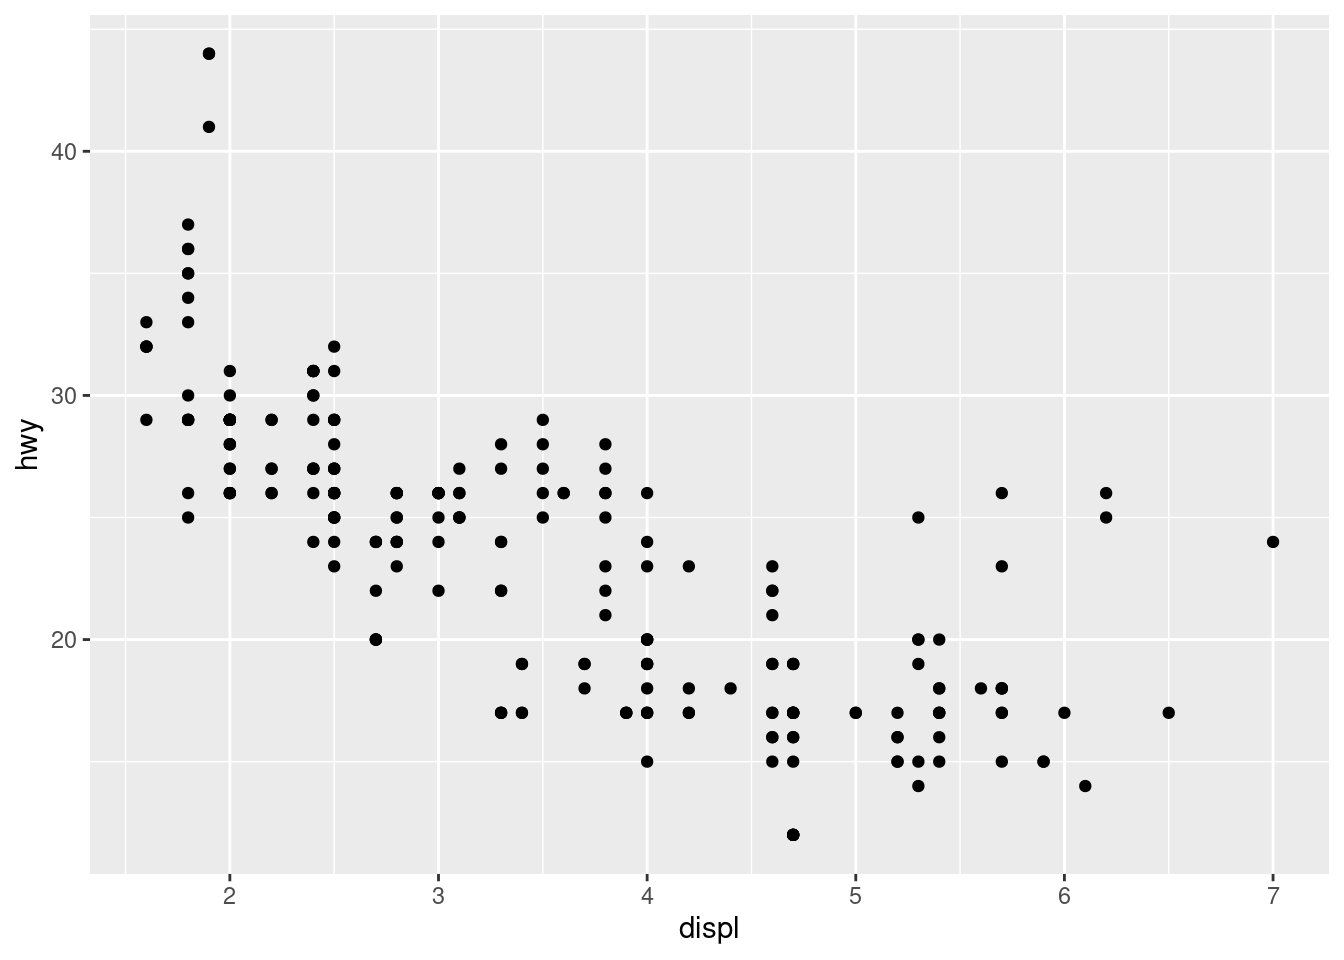
2.tweak each of th R commands so they run properly
── Attaching packages ─────────────────────────────────────── tidyverse 1.3.2 ──
✔ ggplot2 3.4.0     ✔ purrr   1.0.1
✔ tibble  3.1.8     ✔ dplyr   1.1.0
✔ tidyr   1.3.0     ✔ stringr 1.5.0
✔ readr   2.1.3     ✔ forcats 1.0.0
── Conflicts ────────────────────────────────────────── tidyverse_conflicts() ──
✖ dplyr::filter() masks stats::filter()
✖ dplyr::lag()    masks stats::lag()
ggplot(data = mpg) +
  geom_point(mapping = aes(x = displ, y = hwy))
3.Press Alt + Shift + K. What happens? How can you get to the same place using the menus?
i have no idea pretty cool tho
4.Let’s revisit an exercise from the Section 2.6. Run the following lines of code. Which of the two plots is saved as mpg-plot.png? Why?
the my_bar_plot is saved because thats what was specified
my_bar_plot <- ggplot(mpg, aes(x = class)) +
  geom_bar()
my_scatter_plot <- ggplot(mpg, aes(x = cty, y = hwy)) +
  geom_point()
ggsave(filename = "mpg-plot.png", plot = my_bar_plot)