1.What function would you use to read a file where fields were separated with “|”?
read_delim
2.Apart from file, skip, and comment, what other arguments do read_csv() and read_tsv() have in common?
they have almost all of each others arguments
3.What are the most important arguments to read_fwf()?
i don’t know i’ve never used it
4.Sometimes strings in a CSV file contain commas. To prevent them from causing problems, they need to be surrounded by a quoting character, like " or '. By default, read_csv() assumes that the quoting character will be ". To read the following text into a data frame, what argument to read_csv() do you need to specify?
colnames = false
5.Identify what is wrong with each of the following inline CSV files. What happens when you run the code?
read_csv("a,b\n1,2,3\n4,5,6")
Warning: One or more parsing issues, call `problems()` on your data frame for details,
e.g.:
  dat <- vroom(...)
  problems(dat)
Rows: 2 Columns: 2
── Column specification ────────────────────────────────────────────────────────
Delimiter: ","
dbl (1): a
num (1): b

ℹ Use `spec()` to retrieve the full column specification for this data.
ℹ Specify the column types or set `show_col_types = FALSE` to quiet this message.
# A tibble: 2 × 2
      a     b
  <dbl> <dbl>
1     1    23
2     4    56
read_csv("a,b,c\n1,2\n1,2,3,4")
Warning: One or more parsing issues, call `problems()` on your data frame for details,
e.g.:
  dat <- vroom(...)
  problems(dat)
Rows: 2 Columns: 3
── Column specification ────────────────────────────────────────────────────────
Delimiter: ","
dbl (2): a, b
num (1): c

ℹ Use `spec()` to retrieve the full column specification for this data.
ℹ Specify the column types or set `show_col_types = FALSE` to quiet this message.
# A tibble: 2 × 3
      a     b     c
  <dbl> <dbl> <dbl>
1     1     2    NA
2     1     2    34
read_csv("a,b\n\1")
Warning: One or more parsing issues, call `problems()` on your data frame for details,
e.g.:
  dat <- vroom(...)
  problems(dat)
Rows: 1 Columns: 2
── Column specification ────────────────────────────────────────────────────────
Delimiter: ","
chr (1): a
lgl (1): b

ℹ Use `spec()` to retrieve the full column specification for this data.
ℹ Specify the column types or set `show_col_types = FALSE` to quiet this message.
# A tibble: 1 × 2
  a        b
  <chr>    <lgl>
1 "\u0001" NA
read_csv("a,b\n1,2\na,b")
Rows: 2 Columns: 2
── Column specification ────────────────────────────────────────────────────────
Delimiter: ","
chr (2): a, b

ℹ Use `spec()` to retrieve the full column specification for this data.
ℹ Specify the column types or set `show_col_types = FALSE` to quiet this message.
# A tibble: 2 × 2
  a     b
  <chr> <chr>
1 1     2
2 a     b
read_csv2("a;b\n1;3")
ℹ Using "','" as decimal and "'.'" as grouping mark. Use `read_delim()` for more control.
Rows: 1 Columns: 2── Column specification ────────────────────────────────────────────────────────
Delimiter: ";"
dbl (2): a, b
ℹ Use `spec()` to retrieve the full column specification for this data.
ℹ Specify the column types or set `show_col_types = FALSE` to quiet this message.
# A tibble: 1 × 2
      a     b
  <dbl> <dbl>
1     1     3
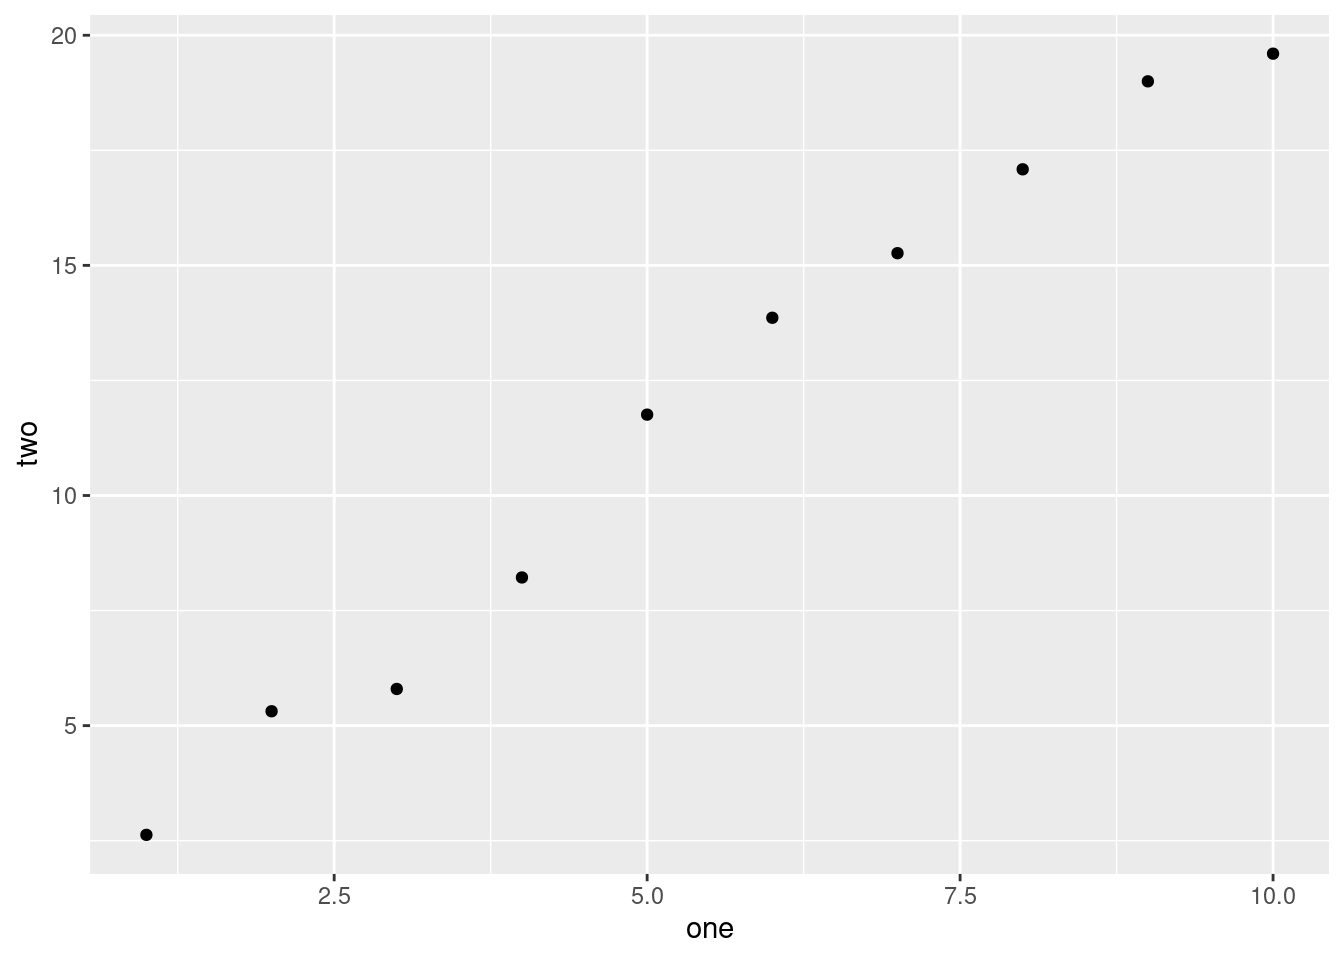
6.Practice referring to non-syntactic names in the following data frame by:
Extracting the variable called 1.
Plotting a scatterplot of 1 vs. 2.
Creating a new column called 3, which is 2 divided by 1.